
By Kathy Worley, Acting Director of Environmental Science and Coastal Ecologist
It’s January 2026, which means sea turtle nest monitoring has been in the rear-view mirror for a while, and it’s time for the mangrove field season. I purposely scheduled our annual mangrove monitoring to take place in the winter so we wouldn’t roast or get eaten alive by the mosquitoes and no-see-ums. I get my fill of those elements during sea turtle season in the summer. However, I should not have planned our first day in the field for last Friday, January 16, 2026, when the temperature was in the low 40s, and that’s without factoring in the windchill.
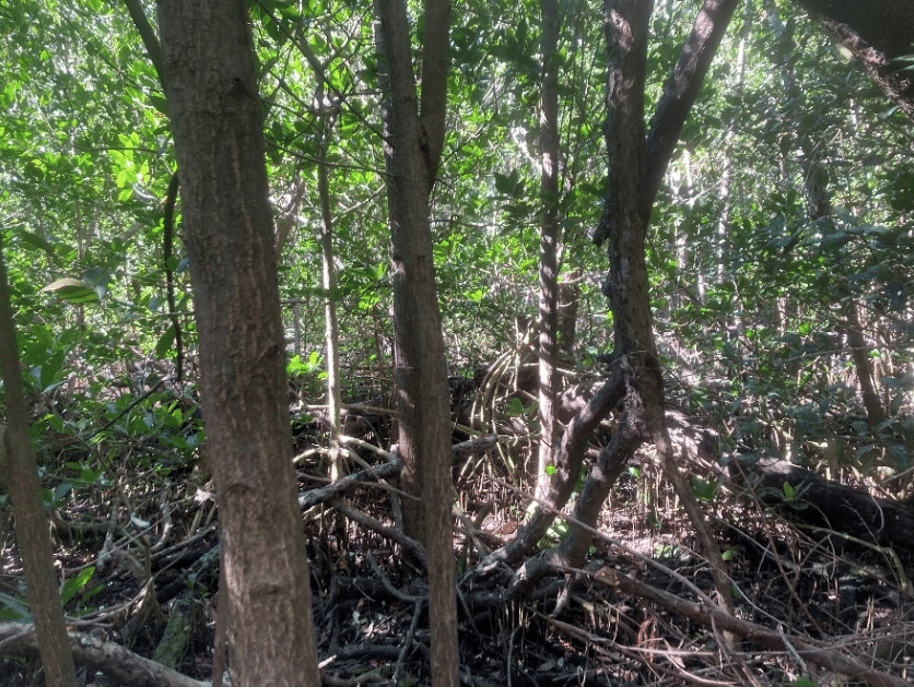
We were working in the Clam Bay mangrove system, in a 6-meter radius plot, and the goal was to complete the tasks before we froze to death. Luckily, the plot was not a difficult one to reach and was an easy one to start the mangrove season. So, we first did a bird survey and, go figure, there were no birds, as they were not crazy enough to be out in this weather! After that pointless exercise where we were frozen in place, trying not to scare off the non-existent birds, it was time to determine the canopy cover. I got out my densiometer and proceeded to stop at 49 equidistant points set out in a radial pattern around the center. At each point, you look through a prism with a mirror that shows you a pair of crosshairs. If you can see the sky through the crosshairs, there is no cover, and if you can’t see the sky, there is cover at that point. We do this at those 49 points within the plot. Then it is just a simple percentage math problem to determine the percentage of times you could not see the sky through the densiometer (i.e., % canopy cover). I know this is old school (or rather the cheap alternative), but if it isn’t broke – don’t fix it!
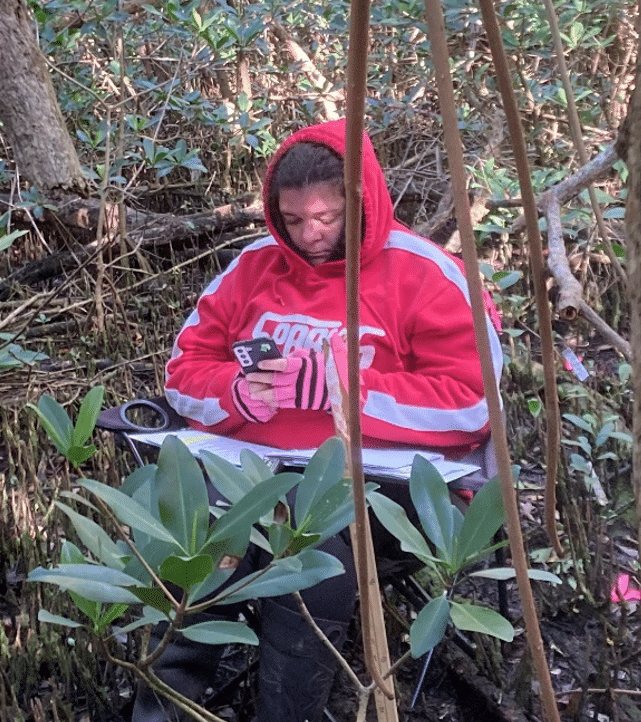
Then it is time to locate all of our previously tagged mangrove trees and seedlings – an exercise we like to call hide and seek, because, believe it or not, sometimes these mangroves just disappear or are not where they are supposed to be. Each mangrove tree or seedling has its own unique number, so we can compare results from year to year. Basically, we give each mangrove in the plot a health physical: Measure its diameter at breast height (DBH), and measure its height if it is a tree or assess its condition if it is a seedling. By this point, my fingertips were so cold that they were hurting, and I had gloves on. Vanessa (pictured) is frozen to the chair! Not to mention it is difficult to bend over to read the seedling tags (toe tags) when you have so many clothes on that you look like the Michelin Man. We were grateful to Ian Bartoszek from the Burmese python team, who gave us some of those handy dandy packages that you shake up and they get warm. Those saved my fingertips from falling off. Finally, we began the last stage of the process, looking for new seedling recruits and giving them a “toe tag” with a unique number, documenting their vital statistics, and figuring out their distance and bearing from the center of the plot in hopes that it will help us locate them next year.
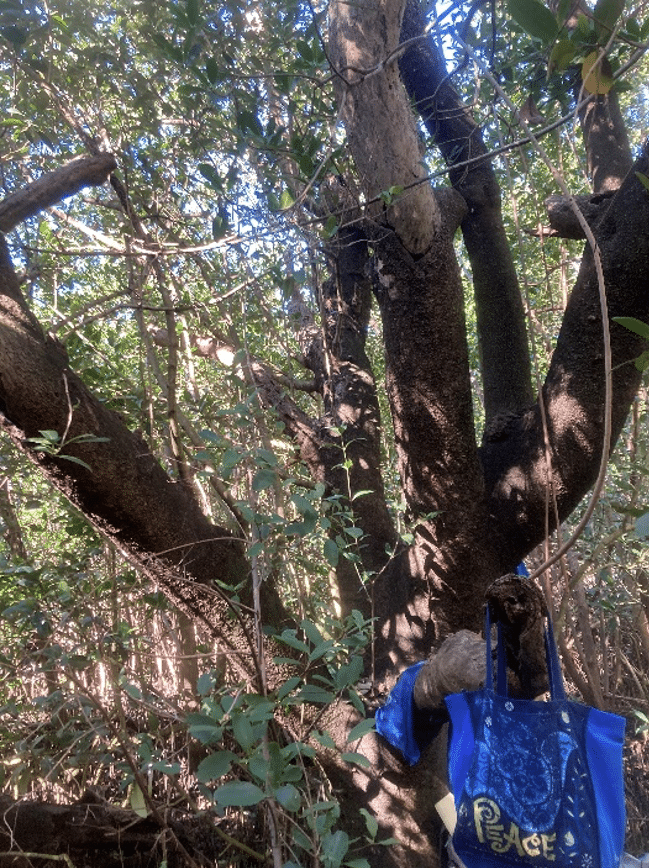
All in all, we were pleased with this plot as it was showing signs of recovering after Hurricane Milton that flattened most of the trees, with a few hardier trees. One of the trees is an old-growth black mangrove, a few centuries old, that takes two of us to measure its DBH! But, honestly, perhaps more important at the time, this plot didn’t have that many trees or seedlings within it, so we could get done quicker and get out of the cold and into the heated cab of our field truck!
Stay tuned for more field stories.